
Mine subsidence and surface change monitoring
Subsidence is measured at pegs: a line of survey marks across the area expected to move, levelled on a schedule. It gives a precise history at the pegs and nothing between them, and the trough that forms where the plan did not put a peg is found by a farmer or a road crew.
Repeat scans of the surface show settlement, cracking and heave across the whole area as a coloured difference on mine grid, and the pegs keep their place as the time-series where the movement turns out to be.
Can 3D scanning monitor mine subsidence?
Yes — repeat scans of the ground on mine grid are overlaid to show settlement, heave and cracking across the whole area, not only at survey pegs.
 The whole surfaceSettlement and heave as a coloured difference across the area, not a peg line.
 Fixed frameRegistered to control outside the moving ground so the change is the ground’s.
 Large areas coveredDriven or flown with a mobile scanner; critical structures from a tripod.
 The baseline keptThe pre-mining surface on record, for the claim that comes years later.
Why subsidence is found by someone else
A subsidence monitoring line is a prediction. Pegs are set across the area the model says will move, levelled before mining and on a schedule afterwards, and the readings are precise. But the trough that develops off the line, the crack that opens along a road not on the plan, the heave at the edge of the panel — these are not at the pegs, and the first report comes from whoever notices them. The mine then has to establish what the ground looked like before, from a survey that was never taken there.
Surface infrastructure makes it worse. A haul road, a pipeline, a power line or a public road over workings has to be watched, and pegs along it give movement at intervals. A localised sink between two pegs is what damages the asset, and it is invisible to a peg line until the asset shows it.
A scanned surface monitors the ground rather than the pegs. Artec Jet on a vehicle records a large area at ±15 mm as it is driven, or on a drone flies it; Artec Ray II from a tripod records a structure or a critical section at 5.3 mm at 40 m. Artec Twins registers each epoch to control outside the moving ground and overlays it on the baseline, so settlement, heave and cracking appear as a coloured difference across the whole area — with the pre-mining surface on record for the claim that comes years later.
From baseline to change map
The baseline is taken before mining reaches the area; each later scan is compared with it.
- 1. Baseline the areaJet from a vehicle or a drone over the whole area; Ray II from a tripod on critical structures.
- 2. Fix the frameTwins registers the baseline to survey control outside the predicted movement.
- 3. Re-scan on scheduleThe same coverage at the monitoring interval, or after an event, from the same control.
- 4. OverlayEach epoch against the baseline: settlement, heave and cracking coloured by magnitude across the area.
 5. ReportChange surfaces and sections to the geotechnical and environmental teams; LAS, LAZ or E57 into the site model.
Which scanner for this work
Subsidence is a large area with a few critical points in it — a mobile scanner for the area, a tripod scanner for the points.
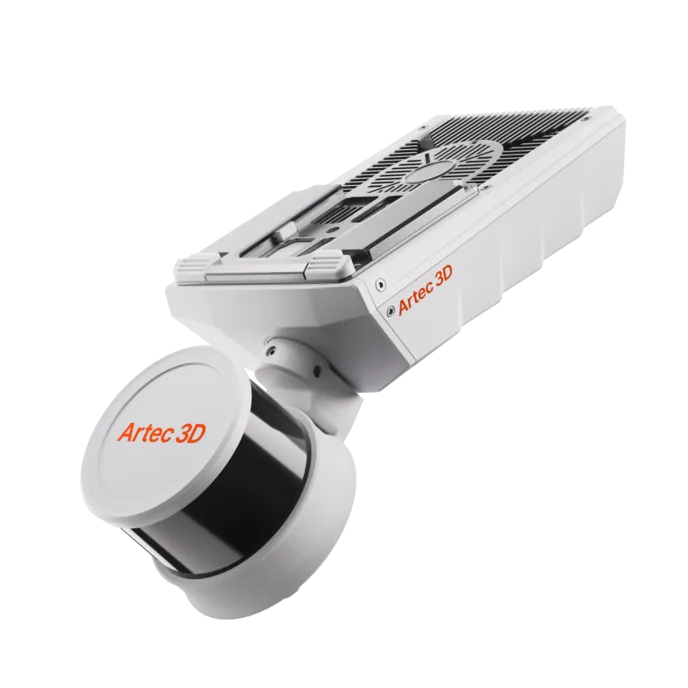
Artec Jet
- Best for
- The whole subsidence area, driven or flown, every epoch
- Type
- Multi-modal SLAM LiDAR
- Accuracy, up to
- ±10 mm underground, ±15 mm general
- Change detection
- ±5 mm
- Range
- 0.5–300 m
- Positional drift
- ±0.03%
- Deployment
- Handheld, backpack, pole, drone, vehicle, cage, robot
Jet on a vehicle records the ground at ±15 mm along every road and track in the area without stopping; on a drone it covers what has no road. With no GPS needed for positioning and 16 hours of onboard capture, a large area is baselined in a day and re-scanned at the monitoring interval.
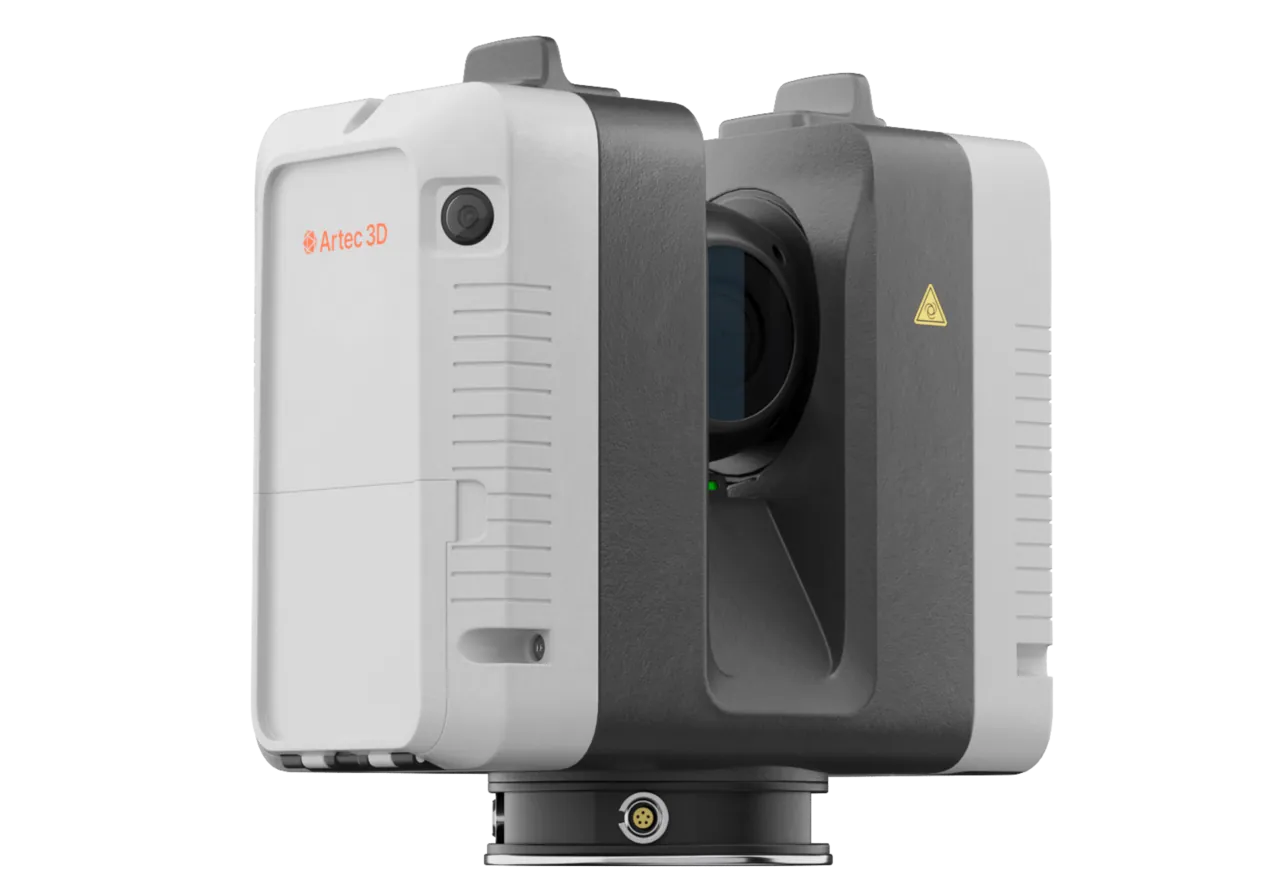
Artec Ray II
- Best for
- Roads, pipelines and structures that need survey-grade change detection
- Type
- Stationary long-range laser, tripod mounted
- Accuracy, up to
- 1.9 mm at 10 m, 2.9 mm at 20 m, 5.3 mm at 40 m
- Range noise
- 0.4 mm at 10 m
- Range
- 0.5–130 m
- Scan time
- 1 min 42 s at 3 mm, 10 m, without texture
- Field of view
- 360° × 300°
Where an asset over the workings has to be watched closely, Ray II from a tripod records it at 5.3 mm at 40 m with 0.4 mm range noise, so small settlements between epochs read as signal. It registers into the same Twins model as the Jet coverage.
See a subsidence area compared against its pre-mining baseline, with the trough that formed off the peg line shown as a coloured surface — book a demo for your geotechnical and environmental teams.
Book a demoQuestions geotechnical and environmental teams ask
How does this work alongside our peg lines?
The pegs give a precise time-series at chosen points; the scan shows where movement is happening across the whole area. When the scan finds a trough off the line, that is where the next pegs go.
How is the scanner’s own position kept stable?
Each epoch is registered to survey control outside the predicted movement zone, so the frame is fixed and the difference between epochs is ground movement, not scanner position.
What resolution do we get over a large area?
Jet records at ±15 mm on surface from a vehicle or drone; Ray II adds 5.3 mm at 40 m on the structures that need it. Subsidence of engineering significance is well above both.
Why does the baseline matter so much?
Because the claim comes later. A landholder or an authority asks what the ground looked like before mining, and a complete pre-mining surface on record answers it — where a peg line only answers for the pegs.
Related applications
Tell us about the ground you are monitoring
Describe the workings, the surface above them and what is currently monitored. A mining specialist will come back with how a baseline and re-scan would run and what the change maps would add.