
Overbreak and underbreak analysis
Overbreak is paid for three times: in the extra rock mucked and hauled, in the extra shotcrete and mesh to support a wider opening, and in the dilution when it happens in ore. Underbreak is paid for in the re-work to take it out. Both are managed from a handful of profile shots per round.
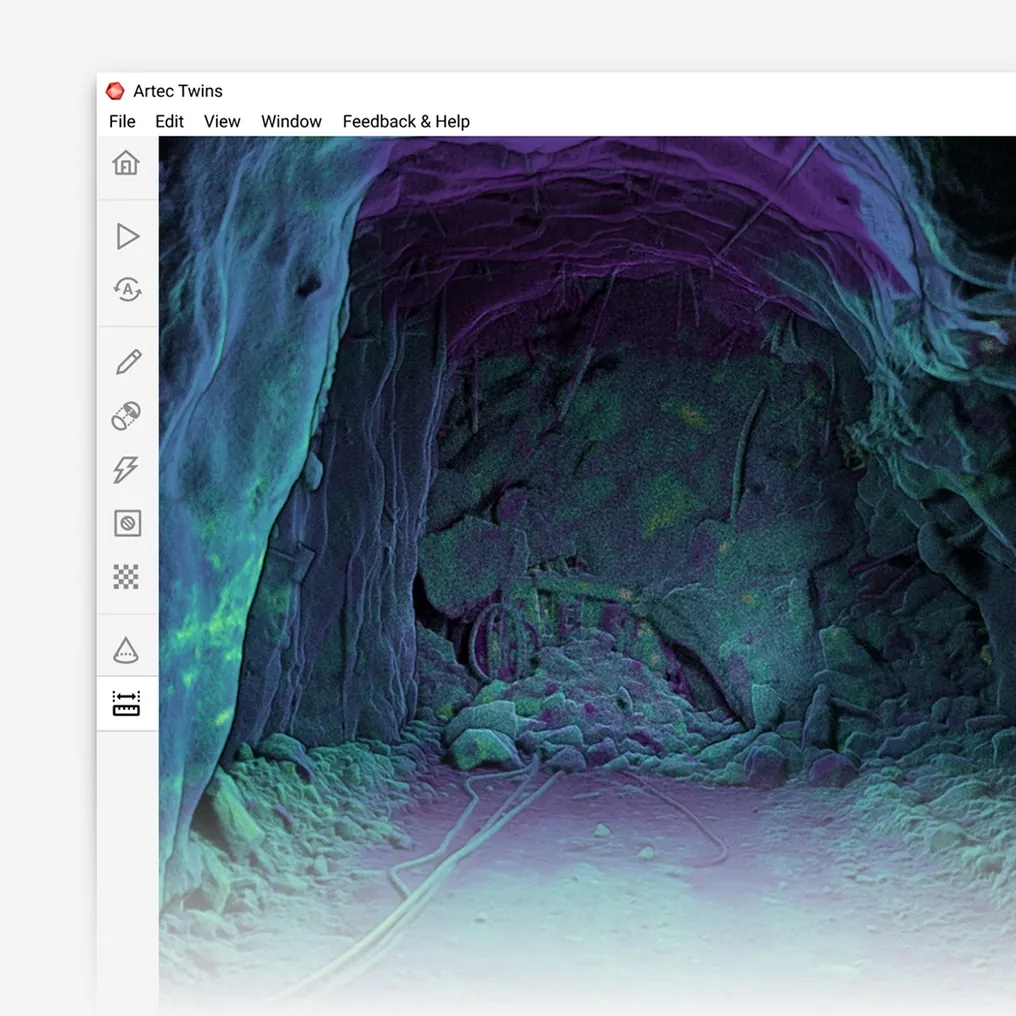
A scan of the same drift gives the profile at every metre against design, with the difference as a coloured surface and a volume, and the drill-and-blast pattern gets corrected from a measurement rather than an impression.
How is overbreak measured from a 3D scan?
The scanned as-mined surface is compared with the design profile at every section; the difference is coloured by distance and summed as a volume, at ±10 mm.
 Design against as-builtThe design profile and the scanned surface overlaid at every metre.
 A volume, not an impressionOverbreak and underbreak summed per round, per metre and per drive.
 Where it happensColoured by distance, so the shoulder that keeps overbreaking is visible.
 Trend by patternCompare rounds across a charge design change and see whether it worked.
Why overbreak is managed by impression
A round is checked with a few profile shots — enough to say whether the drive is roughly on design. Overbreak shows up as a wider muck volume than planned and as a shotcrete order that keeps coming in high, but where exactly it is happening — which shoulder, which part of the back, which round in the cycle — is a matter of the shift boss’s eye. The drill-and-blast pattern gets adjusted on that basis, and whether the adjustment worked is judged the same way.
The cost is spread across so many accounts that it rarely appears as a line. Extra mucking and haulage, extra support, longer cycle times, dilution in ore drives where waste is broken into the ore stream, and underbreak that has to be scaled or re-shot. Each is a few per cent; together they are one of the larger controllable costs in development, and the control is an impression.
A scanned as-built makes the profile a measurement at every metre. Artec Jet records the drift as it is walked, at ±10 mm; Artec Twins overlays the design profile on the capture and colours the difference by distance — over on one side, under on the other — and sums it as a volume per round. The pattern that keeps blowing out a shoulder is visible, and when the charge design is changed, the next rounds show whether it worked.
From scan to a corrected pattern
The analysis runs on the same walk-through that picks up the heading.
 1. Scan the roundJet records the as-mined profile as the heading is walked, at up to 1.9 million points per second.
 2. Register to designTwins ties the capture to mine grid and loads the design profile for the drive.
- 3. CompareDesign against as-built at every metre, with over and under coloured by distance at ±10 mm.
- 4. QuantifyOverbreak and underbreak as volumes per round, per metre and per drive, exported with the sections.
 5. Correct and checkAdjust the pattern or the charge; the next rounds show whether the change held.
Which scanner for this work
The profile comes from the heading survey, so the device is the one that does that.
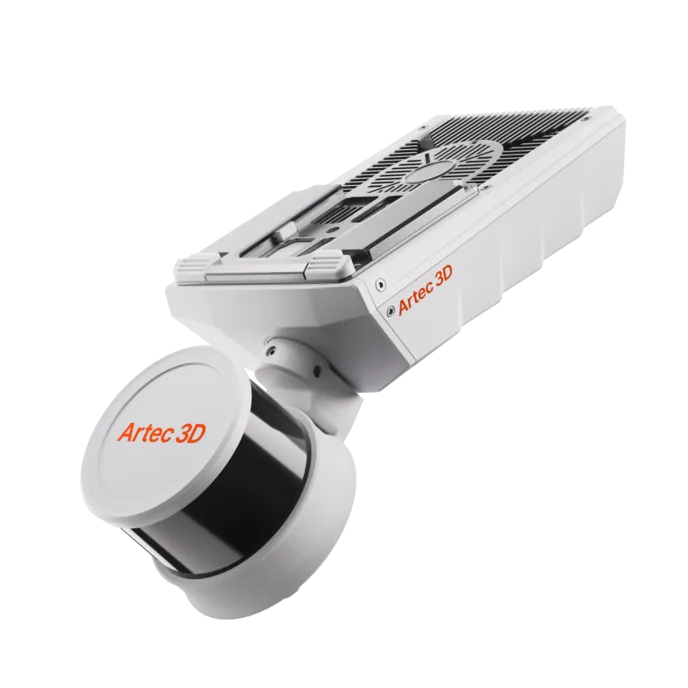
Artec Jet
- Best for
- The as-mined profile of every round, from the same walk that picks up the heading
- Type
- Multi-modal SLAM LiDAR
- Accuracy, up to
- ±10 mm underground, ±15 mm general
- Change detection
- ±5 mm
- Range
- 0.5–300 m
- Positional drift
- ±0.03%
- Deployment
- Handheld, backpack, pole, drone, vehicle, cage, robot
Jet records the complete drift surface at ±10 mm while it is carried through, so the overbreak analysis costs no extra survey time — it is a report run on the pick-up. Its 360° × 290° field of view takes in back and shoulders together, which is where overbreak concentrates, and ±5 mm change detection shows scaling and later movement between visits.
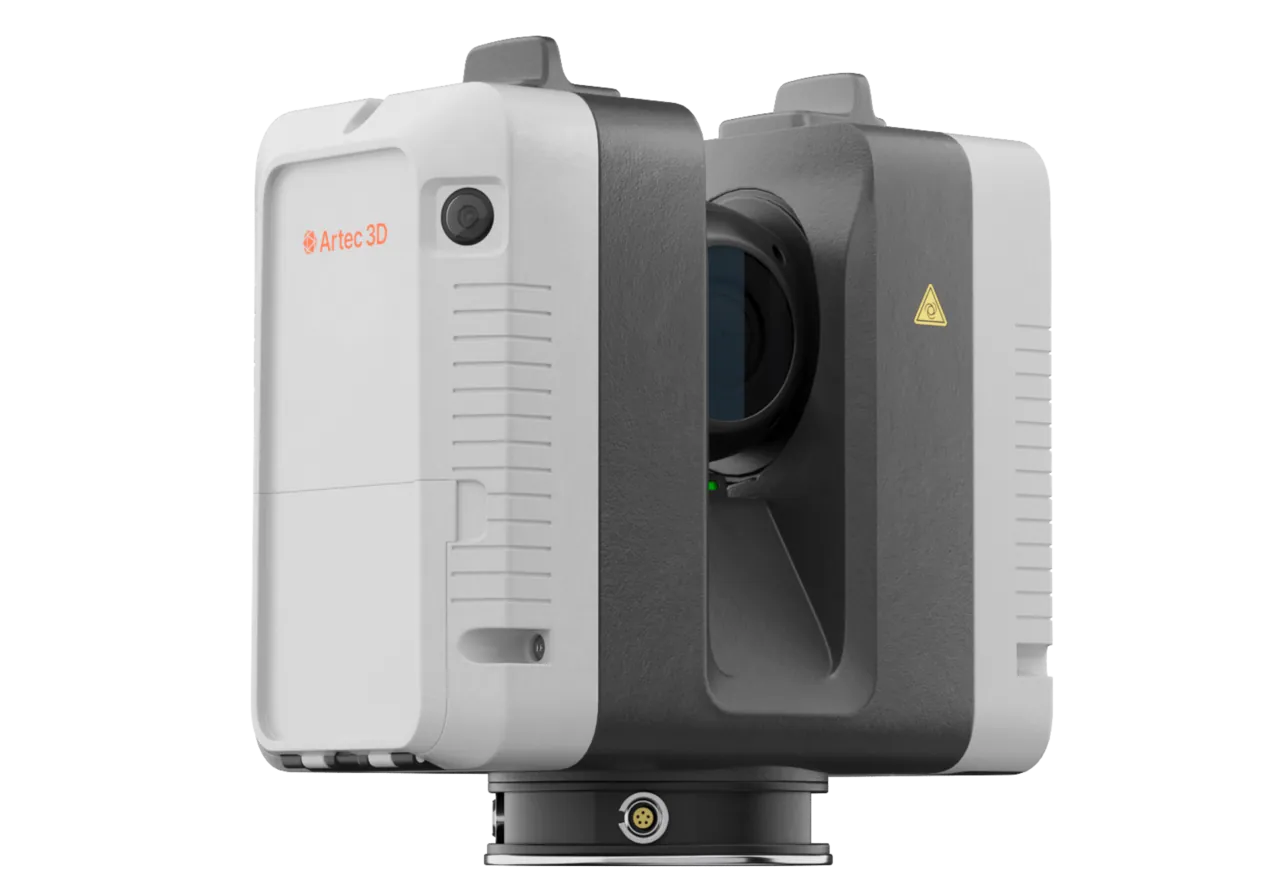
Artec Ray II
- Best for
- Large excavations checked against design at 1.9 mm: chambers, workshops, stations
- Type
- Stationary long-range laser, tripod mounted
- Accuracy, up to
- 1.9 mm at 10 m, 2.9 mm at 20 m, 5.3 mm at 40 m
- Range noise
- 0.4 mm at 10 m
- Range
- 0.5–130 m
- Scan time
- 1 min 42 s at 3 mm, 10 m, without texture
- Field of view
- 360° × 300°
For a large excavation whose profile carries an installation — a crusher chamber, a workshop, a pump station — Ray II on a tripod records the as-mined surface at 1.9 mm at 10 m, and the design comparison runs at that accuracy. Development drives use the walked Jet survey.
See a round’s overbreak coloured against design and summed as a volume, from the same walk that surveyed the heading — book a demo for your drill-and-blast engineer.
Book a demoQuestions drill-and-blast engineers ask
How accurate is the overbreak volume?
The surface is recorded at ±10 mm, and the volume is the integral of the difference from design over the whole section, so it is far closer than an estimate from muck counts or a few profile shots. The trend between rounds is what drives the pattern correction.
Can it separate overbreak in ore from overbreak in waste?
The scan is in mine grid, so where the design profile crosses the ore boundary, overbreak on either side is reported separately. Dilution from overbreak becomes a measured volume.
Does it add time to the pick-up?
No. The analysis runs on the heading survey capture; there is no separate scan. The report is produced when the capture is registered.
What do we hand to the contractor?
Sections at every metre with the difference coloured, and the over and under volumes per round. It is the same dataset both sides look at, in LAS, LAZ or E57 and as sections.
Related applications
Tell us about the drives where overbreak costs you
Describe the development, the ground and how profile is checked today. A mining specialist will come back with what a per-metre comparison would show and how it reaches your planning package.